


Trace View V2 Experimental
browser.traceView records browser interactions as DOM snapshots and lets you replay them step by step in Vitest's built-in trace viewer. It is useful when the live browser view is not enough: you can inspect earlier tests, failed retries, screenshots, assertions, and user actions after the browser has already moved on.
Trace view is additive to the current browser testing workflow. Enabling it does not force a single debugging mode. You can use it with the normal local browser UI, with a headless browser and Vitest UI, or with the HTML reporter in CI.
Trace view, browser UI, and HTML reports
The normal local browser mode opens the browser UI, where tests run in a visible iframe. This is useful while developing, but the iframe only shows the current browser state. When another test runs, the previous rendered state is gone.
browser.traceView keeps a replayable record for each test. In local browser UI mode, the trace viewer appears alongside the existing live view so you can keep using the browser UI while also inspecting recorded steps.
For static output, add the HTML reporter. The same trace viewer can then be opened from the generated report, which is useful for run-mode and CI failures.
Quick Start
Enable trace view with the browser.traceView option:
import { defineConfig } from 'vitest/config'
export default defineConfig({
test: {
browser: {
traceView: true,
},
},
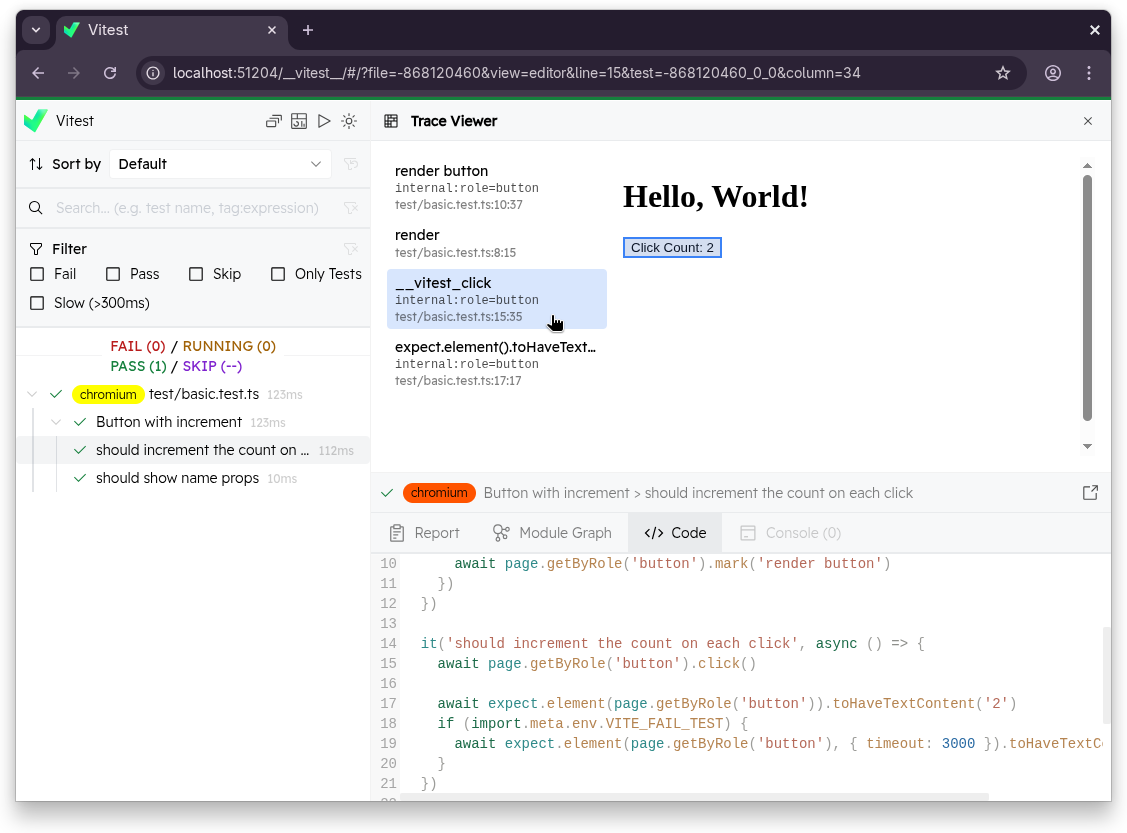
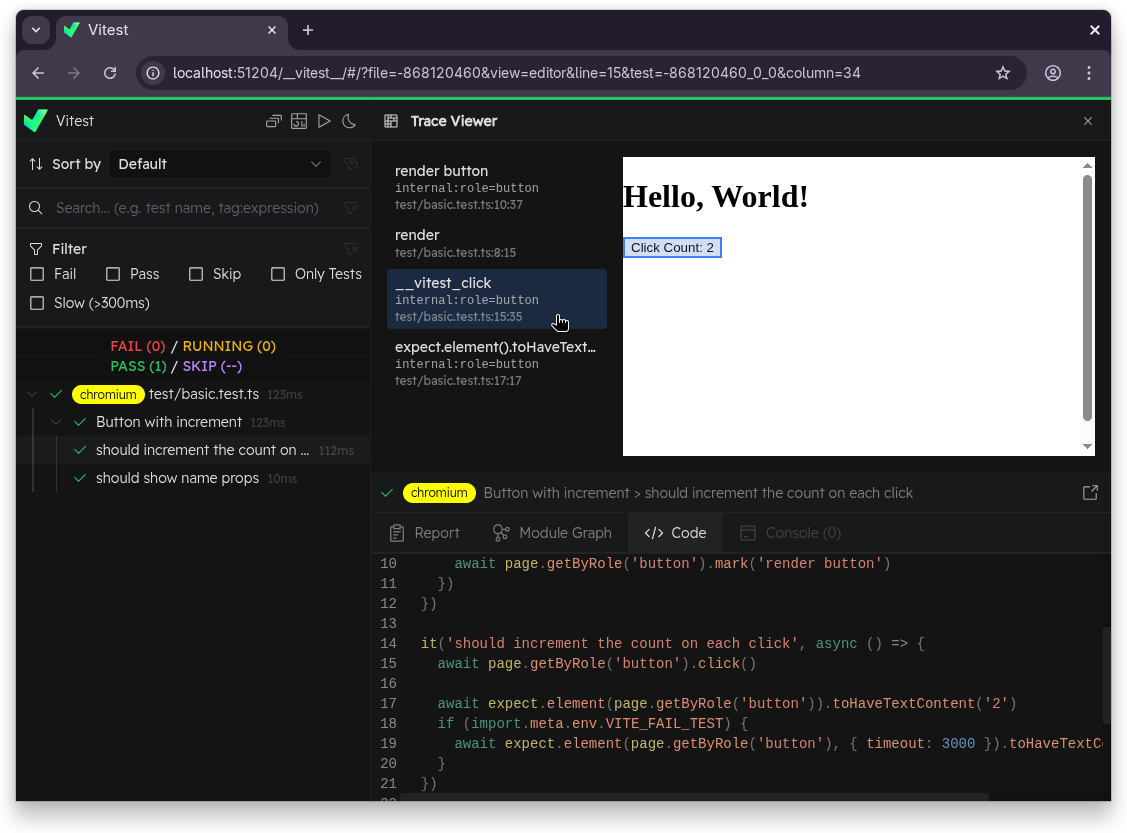
})vitest --browser.traceViewWhen browser.traceView is enabled, tests with recorded traces can be opened in the trace viewer from the browser UI, Vitest UI, and HTML reporter. The viewer has two panes:
- Step list (left) — every recorded interaction and assertion, with name, selector, and source location. Click a step to navigate to it.
- DOM snapshot (right) — a reconstruction of the page at the selected step. The interacted element is highlighted in blue.
Clicking on a step's source location jumps to that line in the Editor tab.
Common Setups
browser.traceView records traces. The browser mode, UI, and reporter options determine where you inspect them.
| Goal | Configuration | Result |
|---|---|---|
| Add trace replay to the normal local browser UI | vitest --browser.traceView | Uses the default local headed browser UI and adds trace replay for recorded tests. |
| Debug locally with a headless browser | vitest --browser.traceView --browser.headless --ui | The browser runs headless, while Vitest UI shows recorded trace steps and snapshots. |
| Debug locally with a visible browser window and Vitest UI | vitest --browser.traceView --browser.headless=false --browser.ui=false --ui | Vitest UI shows recorded trace steps and snapshots, while tests run in a separate headed browser window. |
| Generate a static report for CI or run mode | vitest run --browser.traceView --reporter=html | The HTML report includes the trace viewer for recorded tests. |
Relation to Playwright Traces
browser.traceView and browser.trace are independent features:
browser.traceView | browser.trace | |
|---|---|---|
| Provider support | All providers (playwright, webdriverio, preview) | Playwright only |
| Viewer | Browser UI / Vitest UI / HTML reporter | Playwright Trace Viewer / trace.playwright.dev |
| Format | rrweb DOM snapshots | Playwright .trace.zip |
| Requires external tool | No | Yes (npx playwright show-trace) |
You can enable both at the same time. See Playwright Trace Files for the browser.trace workflow.
Recorded Steps
Trace entries are recorded automatically for:
expect.element(...)assertions- User interaction commands:
click,fill,type,hover,selectOptions,upload,dragAndDrop,tab,keyboard,wheel - Screenshots
Each entry captures the DOM state at that point, along with the selector and the source location that triggered it.
Plain JavaScript assertions like expect(value).toBe(...) run in Node, not the browser, and do not appear in the trace.
Custom Trace Entries
You can insert your own named entries with page.mark() and locator.mark():
import { page } from 'vitest/browser'

await page.mark('content rendered')

await page.getByRole('button', { name: 'Sign in' }).mark('sign in button')
You can also pass a callback to page.mark(). Note that grouping is not currently supported — each inner action is recorded individually, and the mark entry appears at the end:
await page.mark('sign in flow', async () => {
  await page.getByRole('textbox', { name: 'Email' }).fill('john@example.com')
  await page.getByRole('textbox', { name: 'Password' }).fill('secret')
  await page.getByRole('button', { name: 'Sign in' }).click()
})
Use vi.defineHelper() to make entries from reusable helpers point to the call site rather than the helper's internals:
import { vi } from 'vitest'
import { page } from 'vitest/browser'

const renderContent = vi.defineHelper(async (html: string) => {
  document.body.innerHTML = html
  await page.elementLocator(document.body).mark('render')
})

test('shows button', async () => {
  await renderContent('<button>Hello</button>') // trace entry points here
})
Retries and Repeats
Each attempt — retry or repeat — is recorded as a separate trace. When a test has multiple attempts, the viewer opens the most recent one by default. You can switch between attempts in the Report tab.